


- Prices Starting to Out-Pace Value With 50 Percent of the Top 50 Markets Overvalued
- All States Posted Year-Over-Year Price Gains in October 2017
- Home Prices Projected to Increase 4.2 Percent by October 2018
IRVINE, Calif. — (BUSINESS WIRE) — December 5, 2017 — CoreLogic® (NYSE: CLGX), a leading global property information, analytics and data-enabled solutions provider, today released its CoreLogic Home Price Index (HPI™) and HPI Forecast™ for October 2017, which shows home prices are up both year over year and month over month. Home prices nationally increased year over year by 7 percent from October 2016 to October 2017, and on a month-over-month basis home prices increased by 0.9 percent in October 2017 compared with September 2017,* according to the CoreLogic HPI.
This press release features multimedia. View the full release here: http://www.businesswire.com/news/home/20171205005332/en/
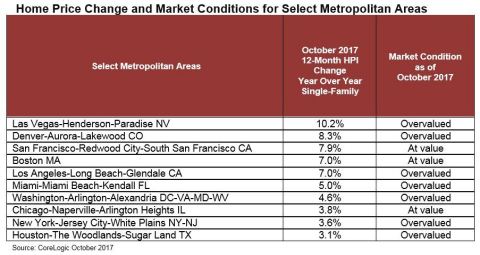
CoreLogic Home Price Change and Market Conditions for Select Metropolitan Areas; October 2017 (Graphic: Business Wire)
Looking ahead, the CoreLogic HPI Forecast indicates that home prices will increase by 4.2 percent on a year-over-year basis from October 2017 to October 2018, and on a month-over-month basis home prices are expected to decrease by 0.2 percent from October 2017 to November 2017. The CoreLogic HPI Forecast is a projection of home prices using the CoreLogic HPI and other economic variables. Values are derived from state-level forecasts by weighting indices according to the number of owner-occupied households for each state.
“Single-family residential sales and prices continued to heat up in October,” said Dr. Frank Nothaft, chief economist for CoreLogic. “On a year-over-year basis, home prices grew in excess of 6 percent for four consecutive months ending in October, the longest such streak since June 2014. This escalation in home prices reflects both the acute lack of supply and the strengthening economy.”
According to CoreLogic Market Condition Indicators (MCI) data, an analysis of housing values in the country’s 100 largest metropolitan areas based on housing stock, 37 percent of metropolitan areas have an overvalued housing stock as of October 2017. The MCI analysis categorizes home prices in individual markets as undervalued, at value or overvalued by comparing home prices to their long-run, sustainable levels, which are supported by local market fundamentals such as disposable income. Also, as of October, 26 percent of the top 100 metropolitan areas were undervalued and 37 percent were at value. When looking at only the top 50 markets based on housing stock, 50 percent were overvalued, 14 percent were undervalued and 36 percent were at value. The MCI analysis defines an overvalued housing market as one in which home prices are at least 10 percent higher than the long-term, sustainable level, while an undervalued housing market is one in which home prices are at least 10 percent below the sustainable level.
“The acceleration in home prices is good news for both homeowners and the economy because it leads to higher home equity balances that support consumer spending and is a cushion against mortgage risk,” said Frank Martell, president and CEO of CoreLogic. “However, for entry-level renters and first-time homebuyers, it leads to tougher affordability challenges. According to the CoreLogic Single-Family Rent Index, rents paid by entry-level renters for single-family homes rose by 4.2 percent from October 2016 to October 2017 compared with overall single-family rent growth of 2.7 percent over the same time.”
*September 2017 data was revised. Revisions with public records data are standard, and to ensure accuracy, CoreLogic incorporates the newly released public data to provide updated results.
The CoreLogic HPI™ is built on industry-leading public record, servicing and securities real-estate databases and incorporates more than 40 years of repeat-sales transactions for analyzing home price trends. Generally released on the first Tuesday of each month with an average five-week lag, the CoreLogic HPI is designed to provide an early indication of home price trends by market segment and for the “Single-Family Combined” tier representing the most comprehensive set of properties, including all sales for single-family attached and single-family detached properties. The indexes are fully revised with each release and employ techniques to signal turning points sooner. The CoreLogic HPI provides measures for multiple market segments, referred to as tiers, based on property type, price, time between sales, loan type (conforming vs. non-conforming) and distressed sales. Broad national coverage is available from the national level down to ZIP Code, including non-disclosure states.
CoreLogic HPI Forecasts™ are
based on a two-stage, error-correction econometric model that combines
the equilibrium home price—as a function of real disposable income per
capita—with short-run fluctuations caused by market momentum,
mean-reversion, and exogenous economic shocks like changes in the
unemployment rate. With a 30-year forecast horizon, CoreLogic HPI
Forecasts project CoreLogic HPI levels for two tiers—“Single-Family
Combined” (both attached and detached) and “Single-Family Combined
Excluding Distressed Sales.” As a companion to the CoreLogic HPI
Forecasts, Stress-Testing Scenarios align with Comprehensive Capital
Analysis and Review (CCAR) national scenarios to project five years of
home prices under baseline, adverse and severely adverse scenarios at
state, Core Based Statistical Area (CBSA) and ZIP Code levels. The
forecast accuracy represents a 95-percent statistical confidence
interval with a +/- 2.0 percent margin of error for the index.


 Animation, 3D Art and 3D Models")